Summary: The first COVID-19 death in the Netherlands was reported on 6 March 2020. The first chart shows the total number of this year’s deaths as reported by cbs.nl, the average number of weekly deaths in the 5 previous years from cbs.nl, the number of COVID-19 deaths from worldometers.info/coronavirus and the calculated number of Excess deaths (if any).
Tag: #RIVM

Summary: On 3 April 2020 the Netherlands had the 5th highest number of COVID-19 Deaths per capita in the EU and it was also the 5th worldwide, but in number of COVID-19 Tests it was only 17th in the EU and 35th globally. To increase the Dutch testing capability, the government appointed a “coronagezant” (“corona envoy”) in the last week of March. However, instead of improving its ranking in the number of COVID-19 Tests, the Netherlands has dropped from 17th to 23rd place in the EU (5th from the bottom) and globally it fell from 35th to 59th place. Recently it has recovered slightly.
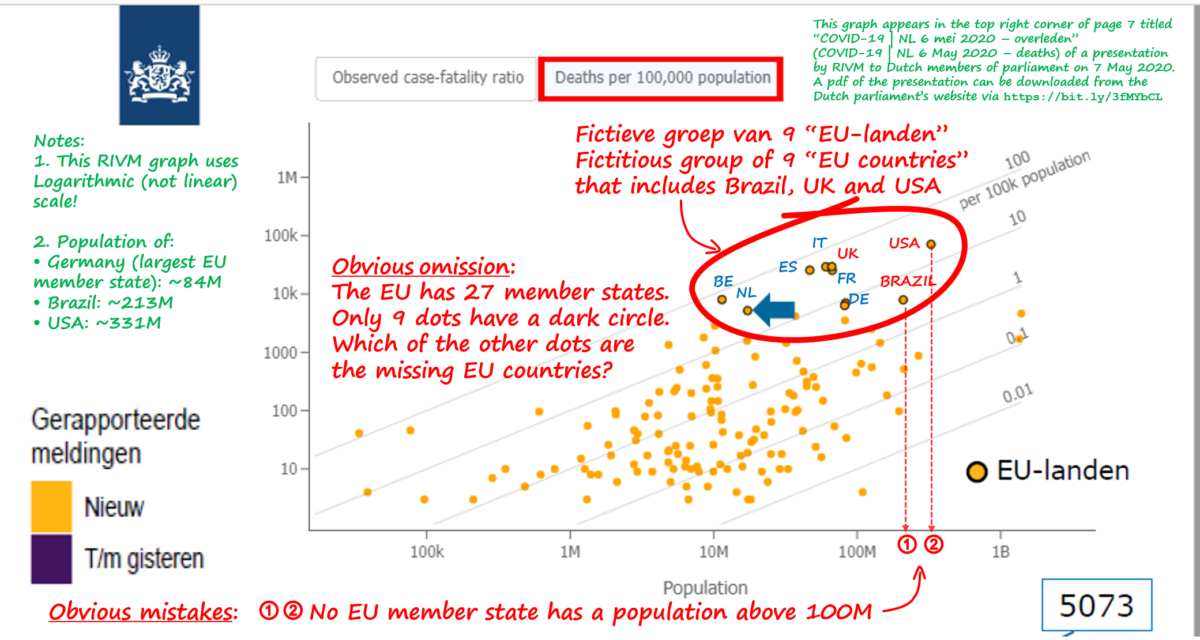
Summary: RIVM, the Dutch goverment’s institute for public health and environment, showed the same fake graph as two weeks earlier. This time it wasn’t China, but Brazil, and again the USA, that were marked as EU country. All done in a poor attempt to hide the truth about the high number of COVID-19 deaths in the Netherlands.
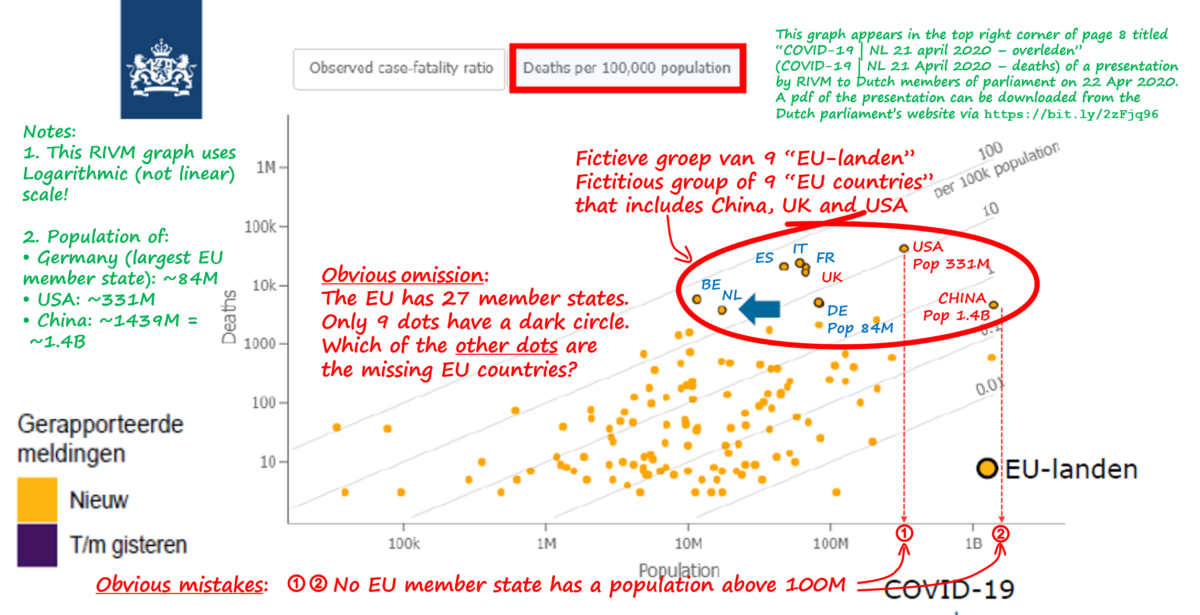
Summary: Within a period of 4 days in April 2020, President Trump in the USA and the Dutch RIVM (Institute for Public Health and Environment) in the Netherlands, presented what should have been a simple chart, showing countries with the highest number of COVID-19 Deaths per 100,000 population. Trump’s chart was an easy to read bar chart – in a glance one can see that Belgium has the highest number, followed by Spain, Italy, France, UK, Netherlands, USA, Iran, Germany and China. In contrast, RIVM’s chart was a scatter chart showing 100+ yellow dots representing countries. Ten of the dots were marked as “EU countries” and the Netherlands was the only country identified, with an arrowhead. One can look at it for 5 minutes and still don’t have a clue which dot has the highest number of deaths per 100,000 population (it wasn’t the dot highest on the chart) and which countries the other dots were representing. The only clear thing about the RIVM chart is that it was deceitfully presented to hide the high number of Dutch COVID-19 deaths.