Summary: Comprehensive COVID-19 charts on countries and regions worldwide, updated daily. This page shows Mortality Rate per Capita (MRpC) charts, per 100,000 population.
Category: Mortality Rate per Capita (MRpC)
Summary: Comprehensive COVID-19 charts on countries and territories worldwide, updated daily. This page shows charts for countries and territories selected by the user.
Summary: Comprehensive COVID-19 charts on countries and regions worldwide, updated daily. Charts on this page are for global regions, the European Union (EU) and the other European (non-EU) countries. Complete charts for all world regions are on separate pages by chart type.
Summary: The number of COVID-19 deaths has exceeded one million worldwide on 27 Sep 2020, eight months after the first casualties were reported in Wuhan, China. More than half of the deaths (52%) were in the USA, Brazil, India and Mexico, the four countries with the highest number of deaths. This page shows Mortality Rate per Capita (MRpC) charts, per 100,000 population.
Summary: A new COVID-19 milestone was reached on 16 Sep 2020 as the number of COVID-19 cases exceeded 30 million worldwide. It took five months to reach the first 10 million cases, six weeks to reach 20 million, and five and a half weeks to reach 30 million cases. This page shows Mortality Rate per Capita (MRpC) charts, per 100,000 population.
Summary: Another COVID-19 milestone was reached on 9 Aug 2020 as the number of COVID-19 cases exceeded 20 million worldwide. It took five months to reach the first 10 million cases and only six weeks to reach an additional 10 million cases. This page shows Mortalityy Rate per Capita (MRpC) charts, per 100,000 population.
Summary: Several COVID-19 milestones were reached on 27 June 2020: The number of COVID-19 cases has exceeded 10 million cases and more than half a million COVID-19 deaths have been reported worldwide.
Summary: The first COVID-19 death in the Netherlands was reported on 6 March 2020. The first chart shows the total number of this year’s deaths as reported by cbs.nl, the average number of weekly deaths in the 5 previous years from cbs.nl, the number of COVID-19 deaths from worldometers.info/coronavirus and the calculated number of Excess deaths (if any).

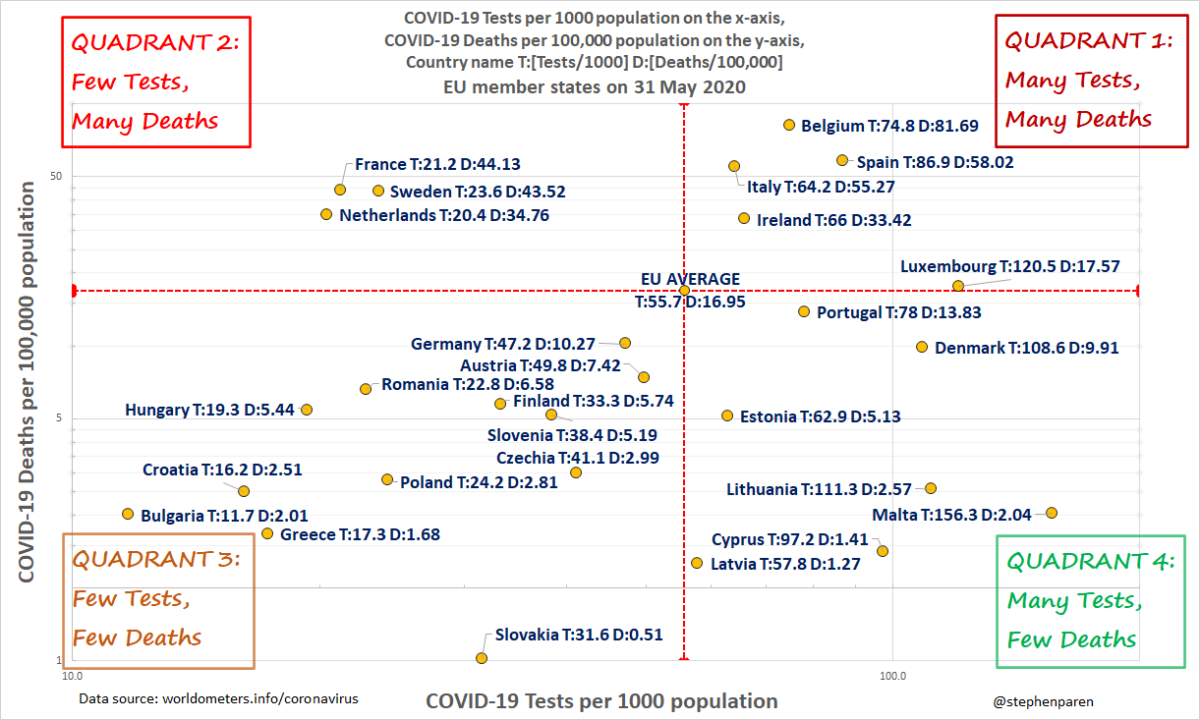
Summary: The bar charts show the number of COVID-19 Deaths and COVID-19 Tests in the EU. The scatter chart shows the number of COVID-19 Deaths and COVID-19 Tests combined in one chart. Three countries with high number of deaths and low number of tests (France, the Netherlands and Sweden) are in the top left quadrant. Lack of testing causes underreporting of COVID-19 deaths as many patients who died without being diagnosed were not counted as COVID-19 cases and also not counted as COVID-19 deaths.
Summary: The bar charts show the number of COVID-19 Deaths and COVID-19 Tests in the EU. The scatter chart shows the number of COVID-19 Deaths and COVID-19 Tests combined in one chart. Three countries with high number of deaths and low number of tests (France, the Netherlands and Sweden) are in the top left quadrant. Lack of testing causes underreporting of COVID-19 deaths as many patients who died without being diagnosed were not counted as COVID-19 cases and also not counted as COVID-19 deaths.