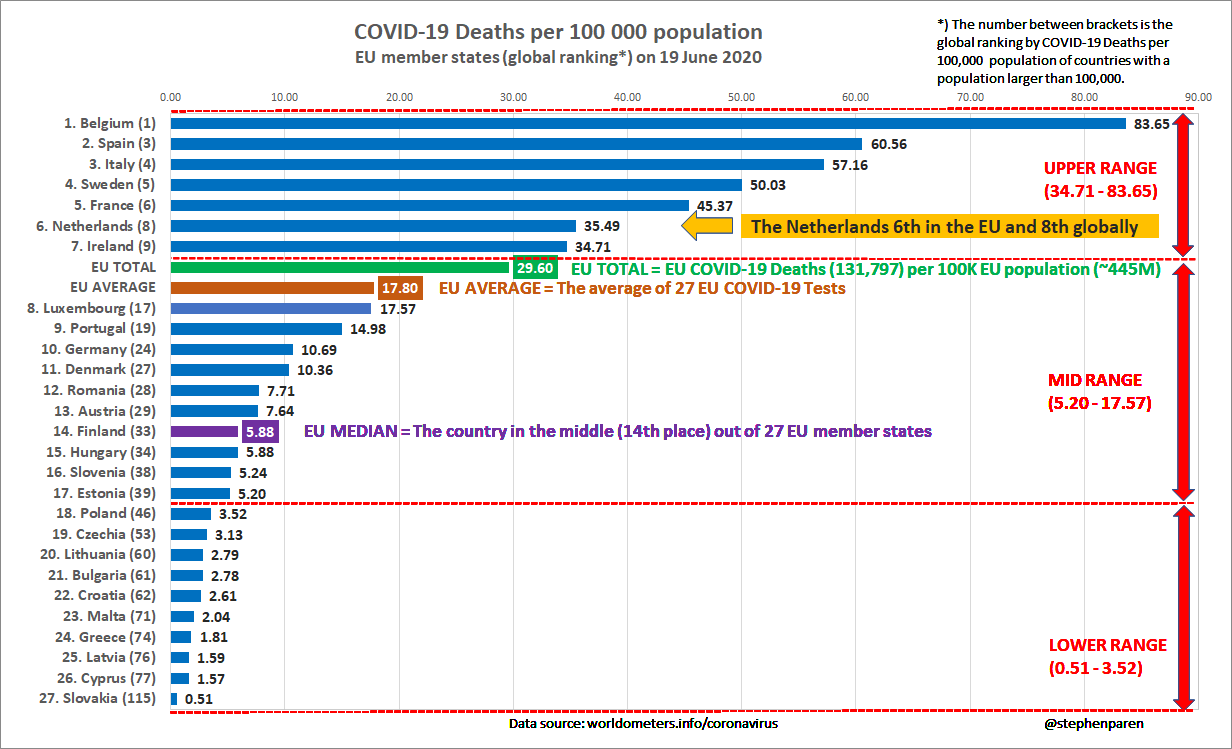
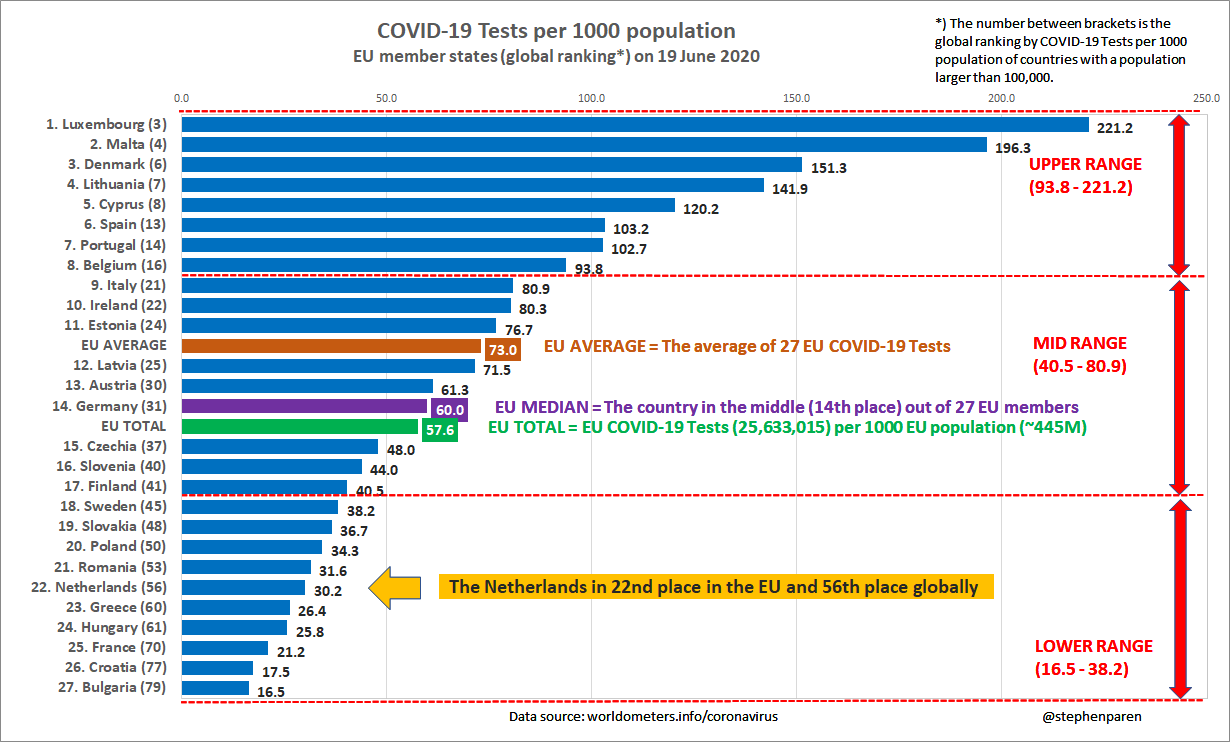
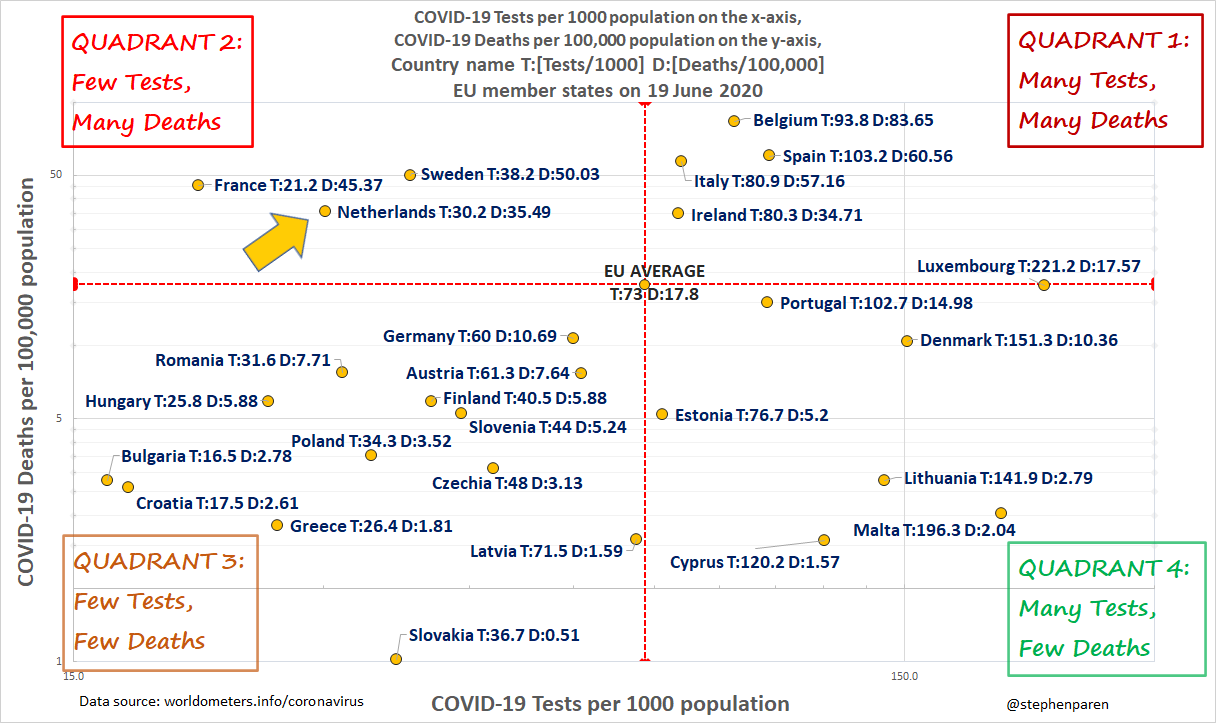
The first COVID-19 death in the Netherlands was reported on 6 March 2020.
The charts below use data from the following sources:
- cbs.nl (the Dutch bureau of statistics):
- Weekly number of deaths (men and women of all ages) in the current year, usually published with a two-week delay
- Weekly number of deaths in the 5 previous years
- worldometers.info/coronavirus :
- Total number of COVID-19 deaths
- New (daily) number of COVID-19 deaths
Move the mouse cursor over the first three charts to see the numbers.
“Excess deaths” as used here is the number of deaths above the average number of deaths in the past five years plus the number of COVID-19 deaths, and is calculated as follows:
- If the total number of weekly deaths is lower than or equal to the 5-year average number of deaths in the corresponding week: zero.
- If the total number of weekly deaths is higher than the 5-year average number of deaths in the corresponding week:
- Excess deaths = Total number of weekly deaths,
less the average number of deaths in the past five years,
less COVID-19 deaths. If the result is negative: zero.
- Excess deaths = Total number of weekly deaths,
- Two percentages are shown for each weekly period:
- The first is the percentage of excess deaths as a percentage of all deaths above the 5-year average;
- The second is the percentage of COVID-19 deaths as a percentage of the sum of COVID-19 deaths and excess deaths.
Daily data on COVID-19 Tests were not always available from our data source:
- Test data from the period before 3 April 2020 was not available;
- Test data from 3 April 2020 onwards was not available on a daily basis;
- On some dates (4 April, 14 April and 11 May; marked with “~”) the number of reported tests were higher than 10,000, which seemed to exceed the COVID-19 test capacity in the Netherlands before June 2020. The average number of COVID-19 tests per day between 1 March and 31 May 2020 (92 days) was 349,150 / 92 = 3,795.
- Where test data was missing or too many tests reported on a single day, we have made adjustments to the daily data on dates marked with “*”.


