Summary: Another COVID-19 milestone was reached on 9 Aug 2020 as the number of COVID-19 cases exceeded 20 million worldwide. It took five months to reach the first 10 million cases and only six weeks to reach an additional 10 million cases. This page shows Mortalityy Rate per Capita (MRpC) charts, per 100,000 population.
Category: COVID-19Deaths
Summary: Another COVID-19 milestone was reached on 9 Aug 2020 as the number of COVID-19 cases exceeded 20 million worldwide. It took five months to reach the first 10 million cases and only six weeks to reach an additional 10 million cases. This page shows Case Fatality Rate (CFR) charts.
Summary: Another COVID-19 milestone was reached on 9 Aug 2020 as the number of COVID-19 cases exceeded 20 million worldwide. It took five months to reach the first 10 million cases and only six weeks to reach an additional 10 million cases. This page shows the Deaths Trajectory charts.
Summary: Several COVID-19 milestones were reached on 27 June 2020: The number of COVID-19 cases has exceeded 10 million cases and more than half a million COVID-19 deaths have been reported worldwide.
Summary: The first COVID-19 death in the Netherlands was reported on 6 March 2020. The first chart shows the total number of this year’s deaths as reported by cbs.nl, the average number of weekly deaths in the 5 previous years from cbs.nl, the number of COVID-19 deaths from worldometers.info/coronavirus and the calculated number of Excess deaths (if any).

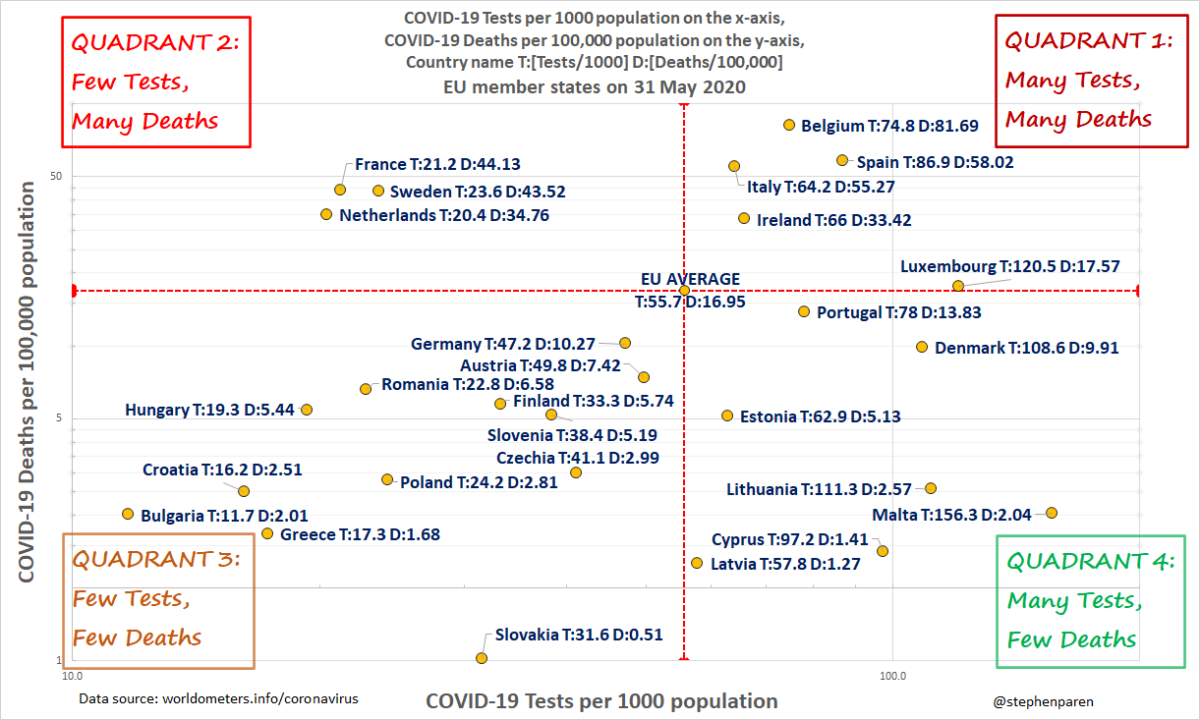
Summary: The bar charts show the number of COVID-19 Deaths and COVID-19 Tests in the EU. The scatter chart shows the number of COVID-19 Deaths and COVID-19 Tests combined in one chart. Three countries with high number of deaths and low number of tests (France, the Netherlands and Sweden) are in the top left quadrant. Lack of testing causes underreporting of COVID-19 deaths as many patients who died without being diagnosed were not counted as COVID-19 cases and also not counted as COVID-19 deaths.

Summary: The bar charts show the number of COVID-19 Deaths and COVID-19 Tests in the EU. The scatter chart shows the number of COVID-19 Deaths and COVID-19 Tests combined in one chart. Three countries with high number of deaths and low number of tests (France, the Netherlands and Sweden) are in the top left quadrant. Lack of testing causes underreporting of COVID-19 deaths as many patients who died without being diagnosed were not counted as COVID-19 cases and also not counted as COVID-19 deaths.

Summary: On 3 April 2020 the Netherlands had the 5th highest number of COVID-19 Deaths per capita in the EU and it was also the 5th worldwide, but in number of COVID-19 Tests it was only 17th in the EU and 35th globally. To increase the Dutch testing capability, the government appointed a “coronagezant” (“corona envoy”) in the last week of March. However, instead of improving its ranking in the number of COVID-19 Tests, the Netherlands has dropped from 17th to 23rd place in the EU (5th from the bottom) and globally it fell from 35th to 59th place. Recently it has recovered slightly.

100,000 population in EU member states and the UK on 13 May 2020.
Summary: The bar charts show the number of COVID-19 Deaths and COVID-19 Tests in the EU. The scatter chart shows the number of COVID-19 Deaths and COVID-19 Tests combined in one chart. Three countries with high number of COVID-19 deaths (France, the Netherlands and Sweden) are in the top left quadrant with low number of tests. Lack of testing causes underreporting of COVID-19 deaths as many patients who died without being diagnosed were not counted as COVID-19 cases.

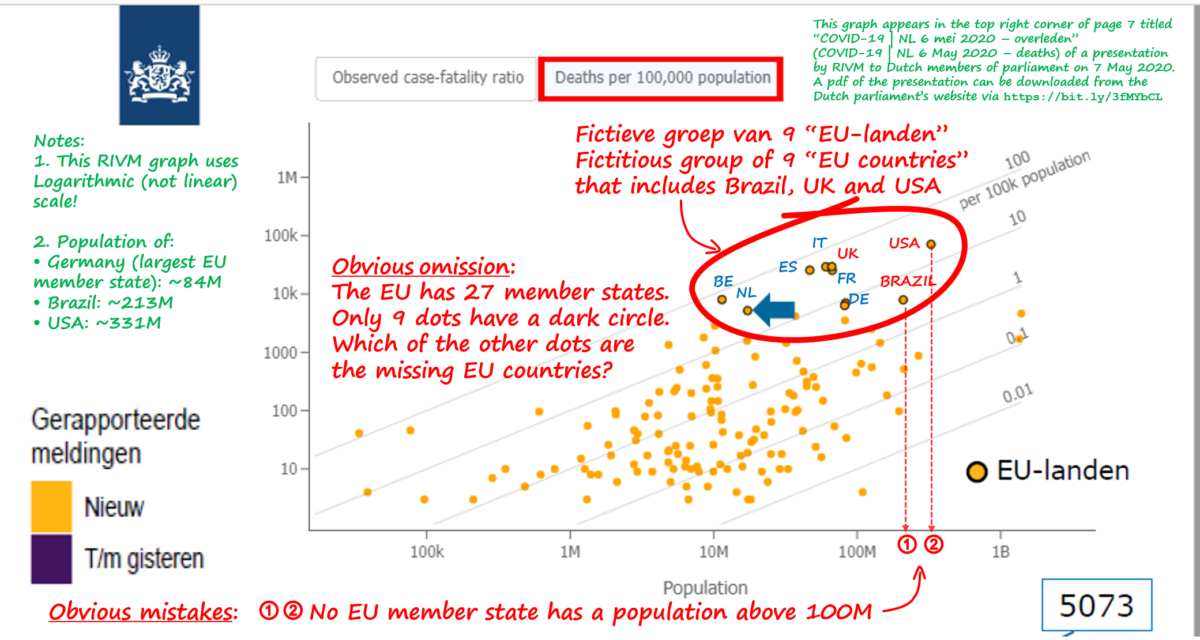
Summary: RIVM, the Dutch goverment’s institute for public health and environment, showed the same fake graph as two weeks earlier. This time it wasn’t China, but Brazil, and again the USA, that were marked as EU country. All done in a poor attempt to hide the truth about the high number of COVID-19 deaths in the Netherlands.