Categories
CoronaVirus COVID-19 COVID-19Cases COVID-19Deaths Infection Rate Mortality Rate Statistics

COVID-19 Charts 21 Jan 2022 – EU member states with Pop. 1M – 20M

Summary:
Selected COVID-19 charts on EU member states with a population size between 1 million and 20 million, on 21 Jan 2022.

Preview(opens in a new tab)

Preview(opens in a new tab)

Preview(opens in a new tab)

Selected COVID-19 charts on 21 Jan 2022 on

  • EU member states;
  • Population size between 1 million and 20 million.

Notes:

  1. All the charts (except the PREVIEW image) are created dynamically.
  2. You can hover above a horizontal bar to see the underlying figures of each country.
  3. If the charts appear scrunched up on the left side (or have expanded too far on the right side), click once on the square icon in the top right corner of the browser to “Restore down” and click once more to “Maximise”.  The charts should appear normally without overlapping texts.
  4. To expand a chart fully across the entire width of the screen, click on the “Home (Reset axes)” icon in the top left corner of the chart. The “Reset axes” icon is invisible until you hover above a chart.
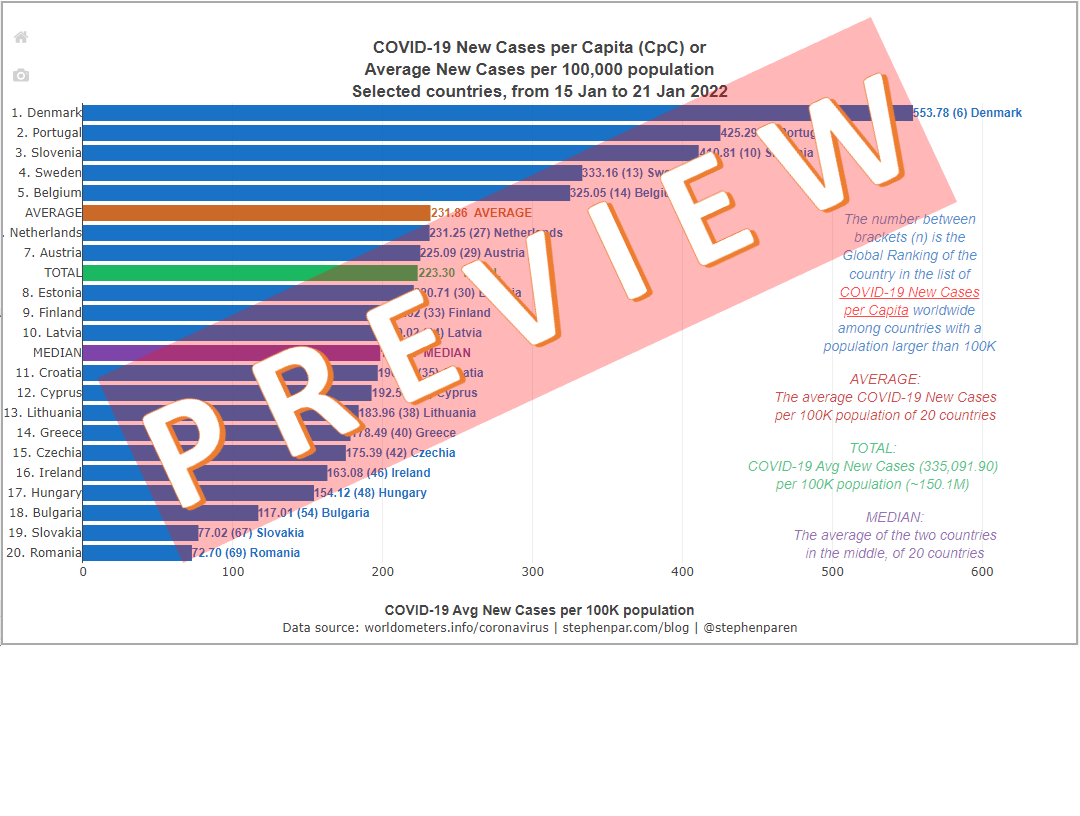
PREVIEW Average New Covid-19 Cases per Capita in EU member states with Pop 1M-20M in 7days 15-21Jan2022

See COVID-19 Charts with your own selection of countries:


The following chart shows:

  • the average number of new daily Covid-19 Cases per Capita (per 100,000 of population)
  • in the 7-day period from 15 to 21 January 2022
  • in EU member states
  • with a population size between 1M and 20M
  • The number between brackets (n) is the Global Ranking of the country in the list of COVID-19 New Cases per Capita worldwide among countries with a population larger than 100K
  • AVERAGE: The average COVID-19 New Cases per 100K population of 20 countries
  • MEDIAN: The average of the two countries in the middle, of 20 countries
  • TOTAL: COVID-19 Avg New Cases (335,091.90) per 100K population (~150.1M)
  •  

    The following chart shows:

    • the total number of Covid-19 Cases
    • from the start of the pandemic in 2020 
    • on 21 January 2022
    • in EU member states
    • with a population size between 1M and 20M
  • The number between brackets (n) is the Global Ranking of the country in the list of COVID-19 Cases in 223 countries worldwide
  • AVERAGE: The average COVID-19 Cases of 20 countries
  • MEDIAN: The average of the two countries in the middle, of 20 countries
  • TOTAL (not on chart): COVID-19 Cases (27,256,250) in 20 countries
  •  

    The following chart shows:

    • the total number of Covid-19 Cases per Capita (per 100,000 of population)
    • from the start of the pandemic in 2020
    • on 21 January 2022
    • in EU member states
    • with a population size between 1M and 20M
  • The number between brackets (n) is the Global Ranking of the country in the list of COVID-19 Cases per Capita worldwide among countries with a population larger than 100K
  • AVERAGE: The average COVID-19 Cases per 100K population of 20 countries
  • MEDIAN: The average of the two countries in the middle, of 20 countries
  • TOTAL: COVID-19 Cases (27,256,250) per 100K population (~150.1M)


  •  

    The following chart shows:

    • the average number of new daily Covid-19 Deaths per Capita (per 100,000 of population)
    • in the 7-day period from 15 to 21 January 2022
    • in EU member states
    • with a population size between 1M and 20M
  • The number between brackets (n) is the Global Ranking of the country in the list of COVID-19 New Deaths per Capita worldwide among countries with a population larger than 100K
  • AVERAGE: The average COVID-19 New Deaths per 100K population of 20 countries
  • MEDIAN: The average of the two countries in the middle, of 20 countries
  • TOTAL: COVID-19 Avg New Deaths (681.938) per 100K population (~150.1M)
  •  

    The following chart shows:

    • the total number of Covid-19 Deaths
    • from the start of the pandemic in 2020
    • on 21 January 2022
    • in EU member states
    • with a population size between 1M and 20M
  • The number between brackets (n) is the Global Ranking of the country in the list of COVID-19 Deaths in 223 countries worldwide
  • AVERAGE: The average COVID-19 Deaths of 20 countries
  • MEDIAN: The average of the two countries in the middle, of 20 countries
  • TOTAL (not on chart): COVID-19 Deaths (354,827) in 20 countries
  •  

    The following chart shows:

    • the total number of Covid-19 Deaths per Capita (per 100,000 of population)
    • also called the Mortality Rate per Capita (MRpC)
    • from the start of the pandemic in 2020
    • on 21 January 2022
    • in EU member states
    • with a population size between 1M and 20M
  • The number between brackets (n) is the Global Ranking of the country in the list of COVID-19 Mortality Rate per Capita worldwide among countries with a population larger than 100K
  • AVERAGE: The average COVID-19 Deaths per 100K population of 20 countries
  • MEDIAN: The average of the two countries in the middle, of 20 countries
  • TOTAL: COVID-19 Deaths (354,827) per 100K population (~150.1M)


  •  

    The following chart shows:

    • the total number of Covid-19 Deaths as a percentage of Covid-19 Cases
    • also called the Case Fatality Rate (CFR)
    • from the start of the pandemic in 2020
    • on 21 January 2022
    • in EU member states
    • with a population size between 1M and 20M
  • The number between brackets (n) is the Global Ranking of the country in the list of COVID-19 Case Fatality Rate (CFR) or Deaths as % of Cases in 211 countries
  • AVERAGE: The average COVID-19 Case Fatality Rate per 100K population of 20 countries
  • MEDIAN: The average of the two countries in the middle, of 20 countries
  • TOTAL: COVID-19 Deaths (354,827) as % of Cases (27,256,250) in 20 countries


  • Leave a Reply