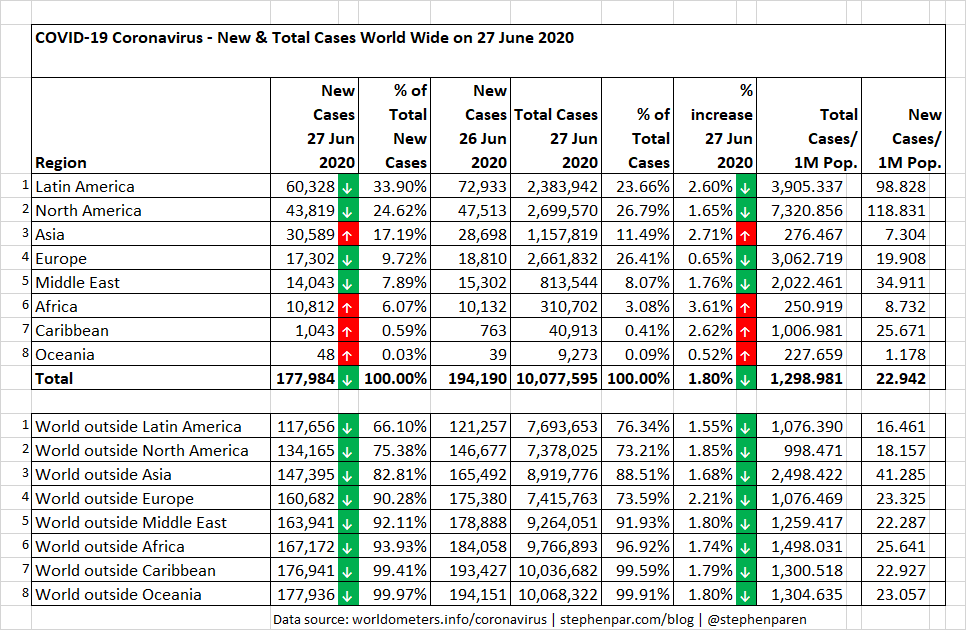
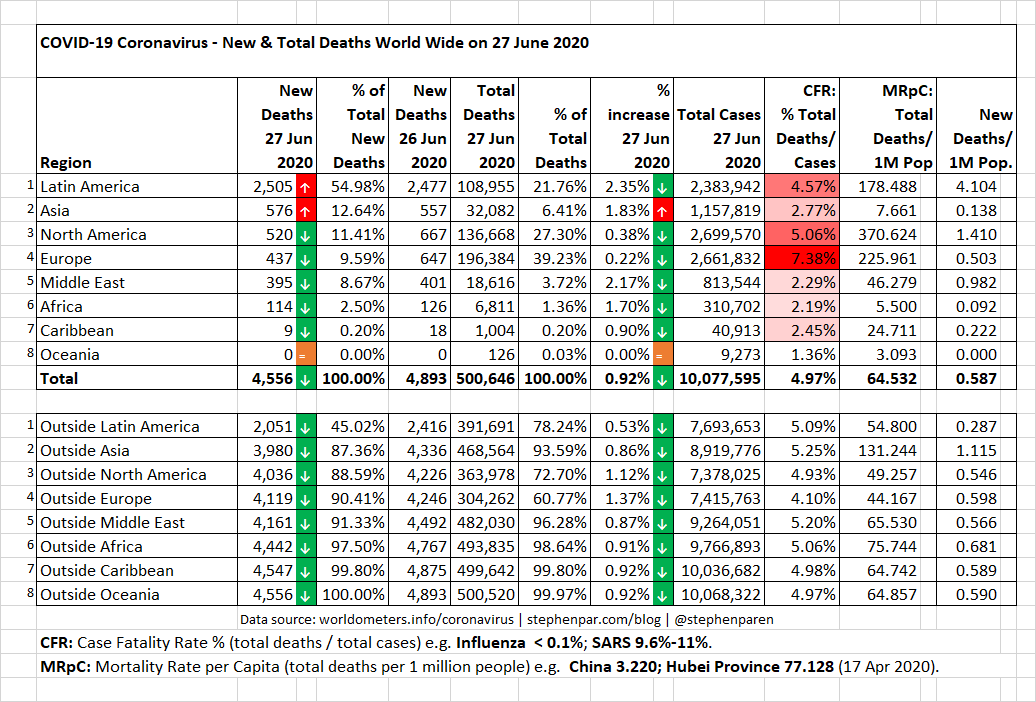
Several COVID-19 milestones were reached on 27 June 2020: The number of COVID-19 cases has reached more than 10 million cases and more than half a million COVID-19 deaths have been reported worldwide.
The first two tables and charts show the number of Cases and Deaths by Region:
- COVID-19 Cases by Region (table & chart)
- COVID-19 Deaths by Region (table & chart)
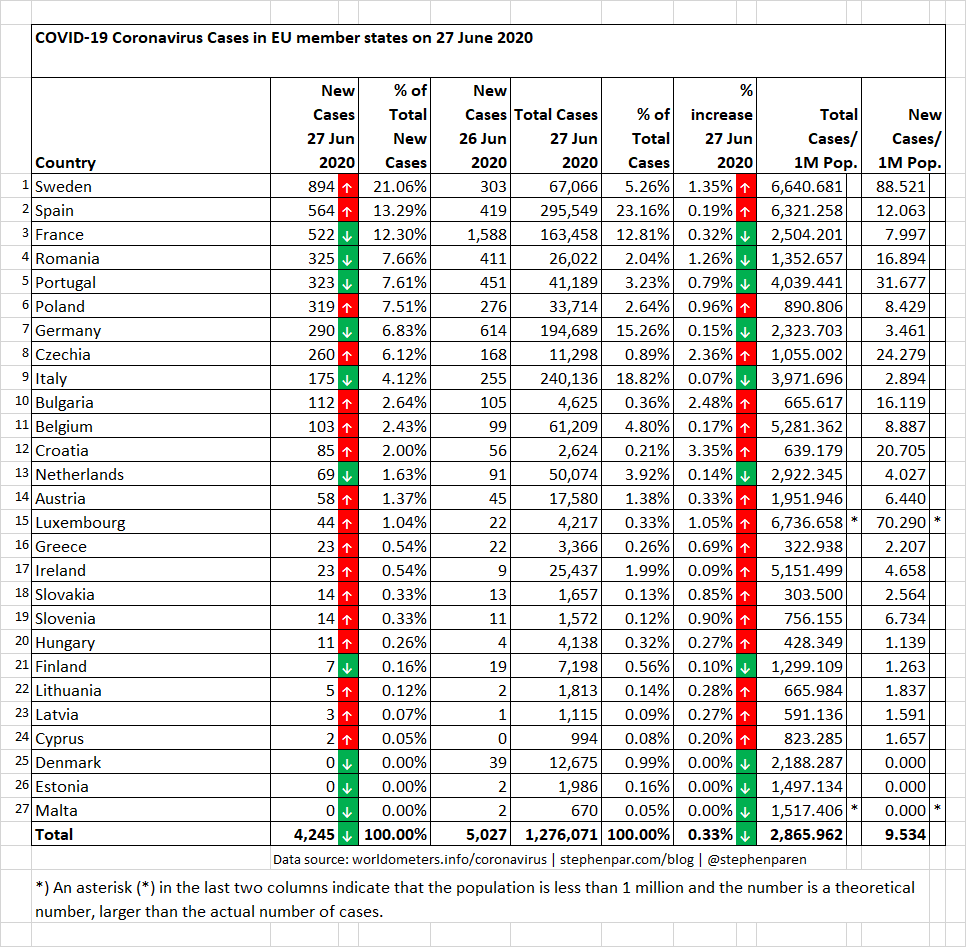
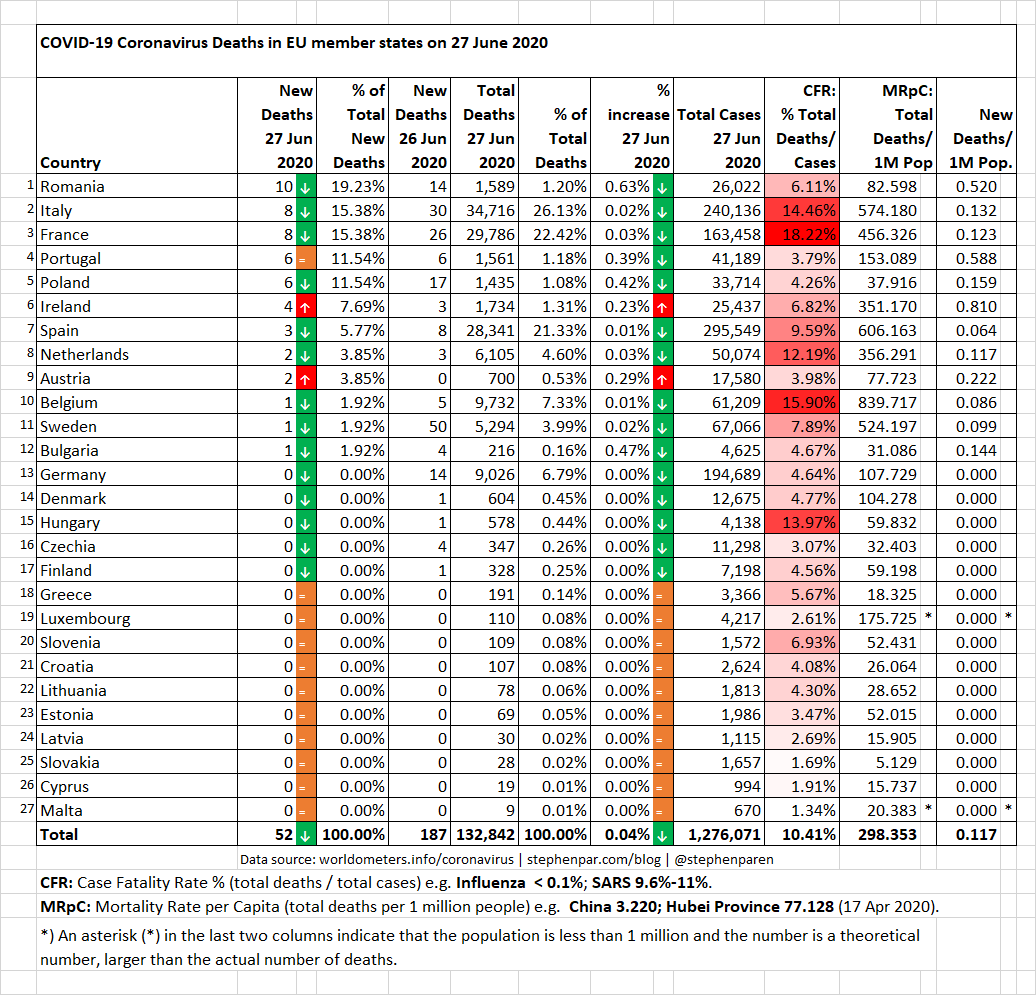
The next group of tables and charts show the number of Cases and Deaths in 27 EU member states:
- COVID-19 New & Total Cases by EU member state (table)
- COVID-19 Cases Trajectory by EU member state (chart)
- COVID-19 Cases per Capita (100K population) by EU member state (chart)
- COVID-19 New & Total Deaths by EU member state (table)
- COVID-19 Deaths Trajectory by EU member state (chart)
- COVID-19 Mortality Rate per Capita (100K population) by EU member state (chart)
The next four charts show the number of Cases and Deaths in non-EU European countries:
- COVID-19 Cases Trajectory by Non-EU European country (chart)
- COVID-19 Cases per Capita (100K population) by Non-EU European country (chart)
- COVID-19 Deaths Trajectory by Non-EU European country (chart)
- COVID-19 Mortality Rate per Capita (100K population) by Non-EU European country (chart)
The next table and charts show the number of Cases in Countries worldwide:
- COVID-19 Cases by Country worldwide (table)
- COVID-19 Cases Trajectory by Country worldwide (chart)
- COVID-19 Cases per Capita (100K population) Top 30 worldwide (chart)
- COVID-19 Cases per Capita (100K population) Top 31-60 worldwide (chart)
- COVID-19 Cases per Capita (100K population) Top 61-90 worldwide (chart)
The last tables and charts show the number of Deaths in Countries worldwide:
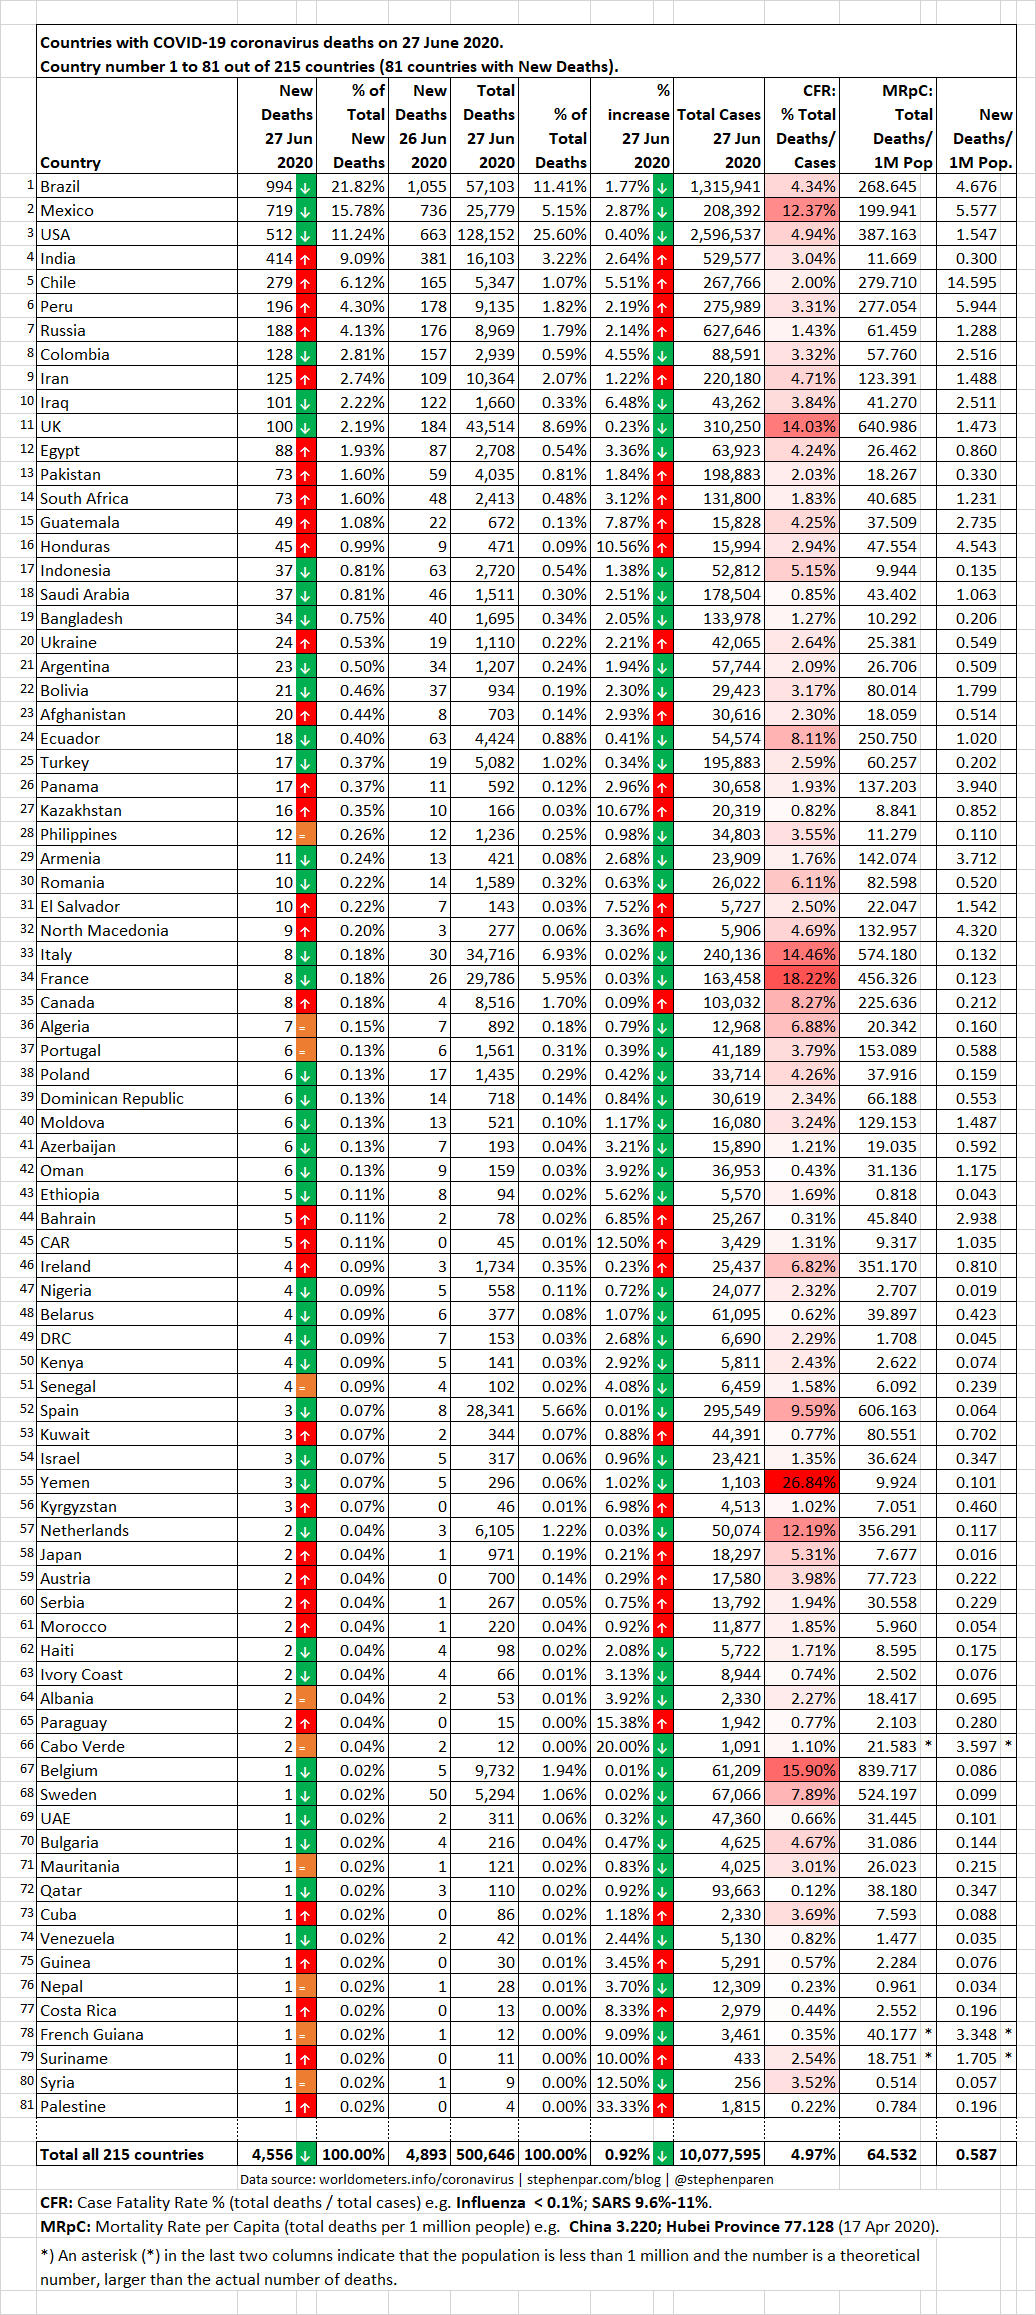
- COVID-19 Deaths by Country worldwide (table of countries with 1 or more New Deaths)
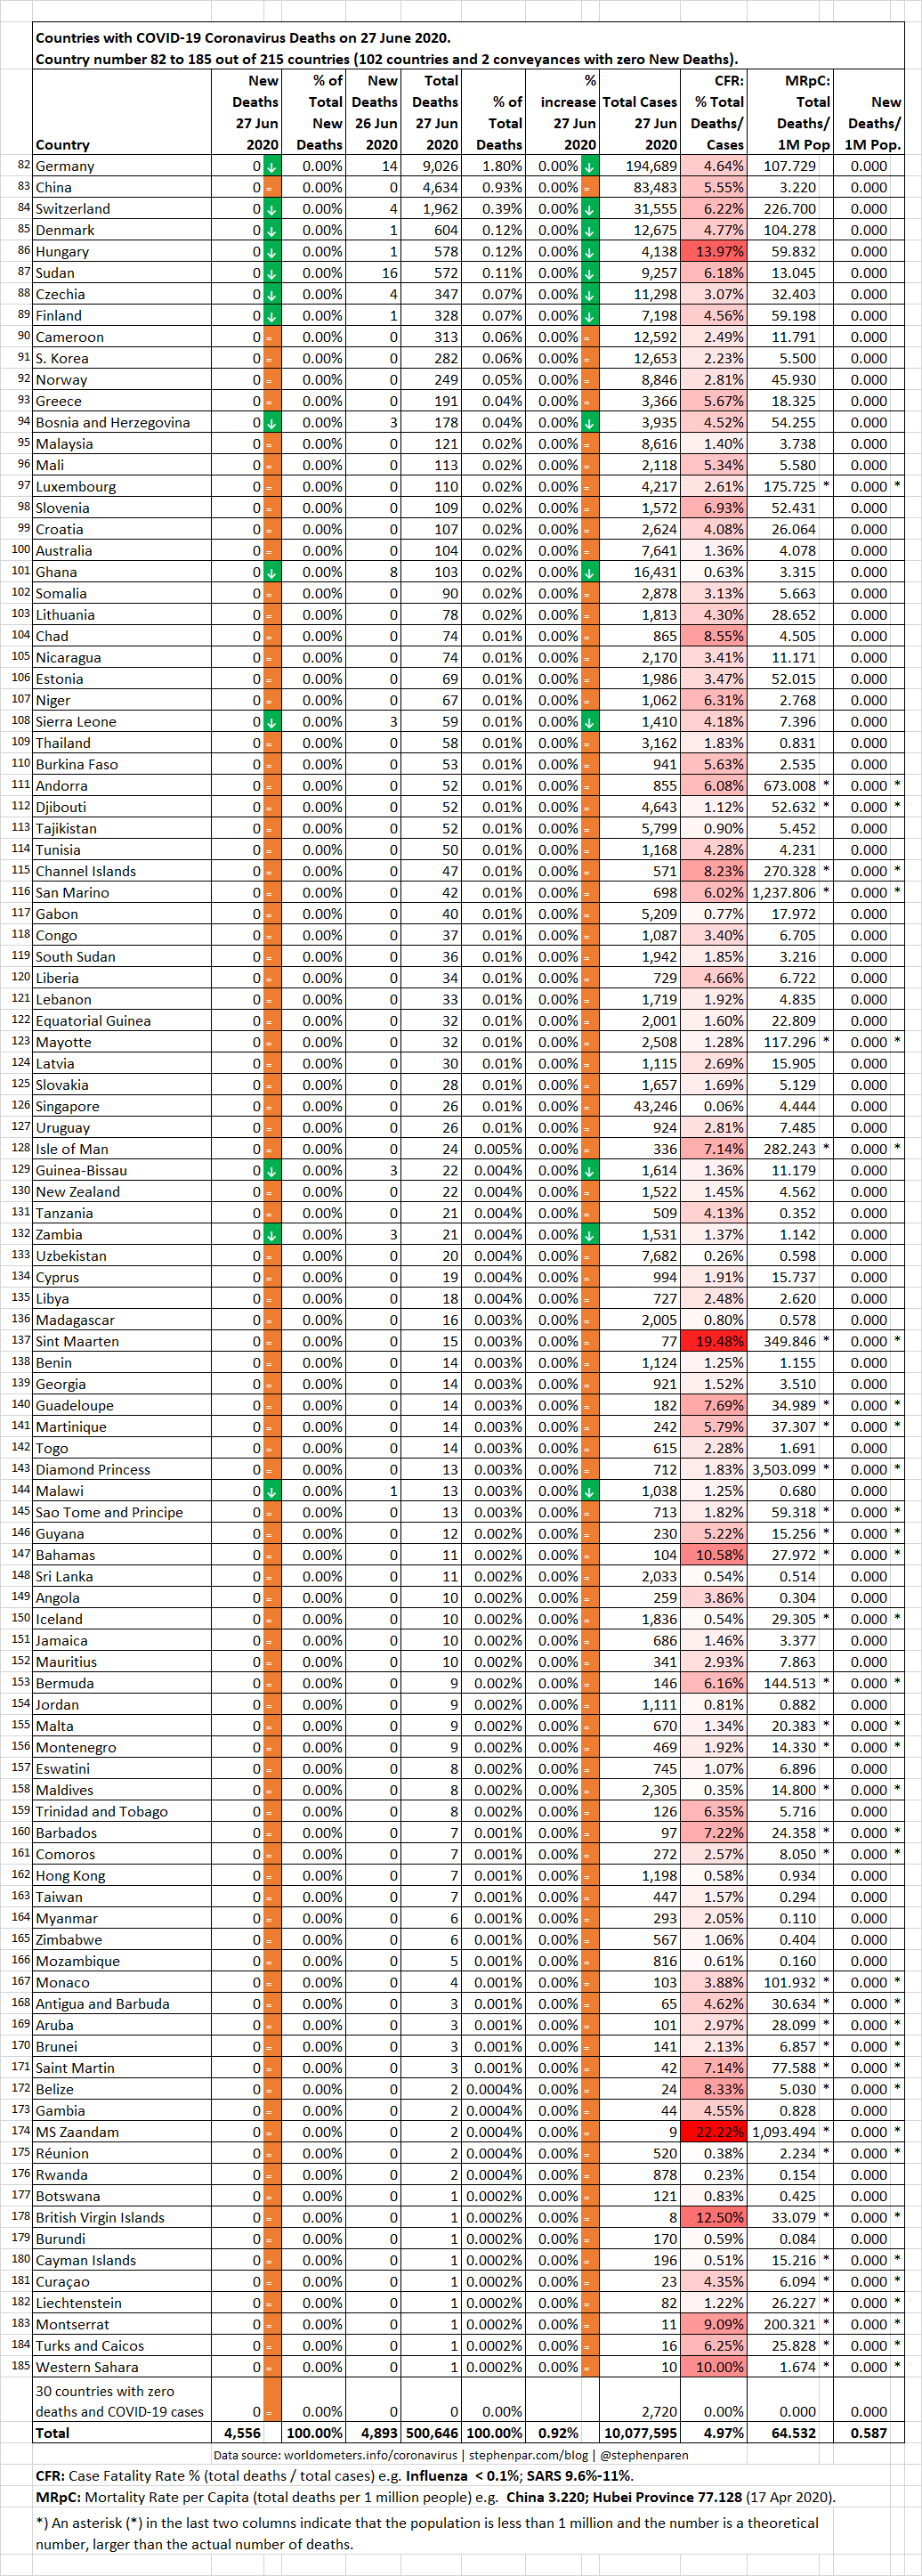
- COVID-19 Deaths by Country worldwide (table of countries with zero New Deaths)
- COVID-19 Deaths Trajectory by Country worldwide (chart showing countries with at least 1 Total COVID-19 Death)
- COVID-19 Cases per Capita (100K population) Top 30 worldwide (chart)
- COVID-19 Mortality Rate per Capita (100K population) Top 30 worldwide (chart)
- COVID-19 Mortality Rate per Capita (100K population) Top 31-60 worldwide (chart)
- COVID-19 Mortality Rate per Capita (100K population) Top 61-90 worldwide (chart)
Move the mouse cursor over the chart to see the underlying numbers.
The width of each vertical bar shows the relative size of the number of Total COVID-19 Cases in each region in comparison with other regions.
The height of each vertical bar shows the number of New COVID-19 Cases in the region.
Move the mouse cursor over the chart to see the underlying numbers.
The width of each vertical bar shows the relative size of the number of Total COVID-19 Deaths in each region in comparison with other regions.
The height of each vertical bar shows the number of New COVID-19 Deaths in the region.
Move the mouse cursor over the chart to see the underlying numbers.
Move the mouse cursor over the chart to see the underlying numbers.
Move the mouse cursor over the chart to see the underlying numbers.
Small numbers with decimals between 0 and 1 (e.g. 0.1) are used to make zeroes visible on a logarithmic scale.
Decimals are also added to the y-value of data points that have exactly the same x and y values as other data point(s), in order to distinguish them on the chart.
Move the mouse cursor over the chart to see the underlying numbers.
Move the mouse cursor over the chart to see the underlying numbers.
Small numbers with decimals between 0 and 1 (e.g. 0.1) are used to make zeroes visible on a logarithmic scale.
Decimals are also added to the y-value of data points that have exactly the same x and y values as other data point(s), in order to distinguish them on the chart.
Move the mouse cursor over the chart to see the underlying numbers.

Move the mouse cursor over the chart to see the underlying numbers.
The y-values are a moving average of the past 7 days. The smallest possible average is 0.14, which is the average of one new case in the past 7 days. Values from 0 to 0.1 are used to make zeroes visible on the logarithmic scale.
Decimals are also added to the y-value of data points that have exactly the same x and y values as other data point(s), in order to distinguish them on the chart.
To inspect overlapping data points, use the “Zoom in” button on the right or draw a rectangle with the mouse cursor to zoom in on a section of the chart. To return to the initial view, click on the “Reset axes” button.
A 7-day moving average lower than 0.14 (0.1 or lower) means that no (zero) New COVID-19 Cases have been reported by the country in the past 7 days, up to and including the date mentioned on the chart.
Move the mouse cursor over the chart to see the underlying numbers.
Move the mouse cursor over the chart to see the underlying numbers.
Move the mouse cursor over the chart to see the underlying numbers.
Move the mouse cursor over the chart to see the underlying numbers.
The y-values are a moving average of the past 7 days. The smallest possible average is 0.14, which is the average of one new death in the past 7 days. Values from 0 to 0.1 are used to make zeroes visible on the logarithmic scale.
Decimals are also added to the y-value of data points that have exactly the same x and y values as other data point(s), in order to distinguish them on the chart.
To inspect overlapping data points, use the “Zoom in” button on the right or draw a rectangle with the mouse cursor to zoom in on a section of the chart. To return to the initial view, click on the “Reset axes” button.
A 7-day moving average lower than 0.14 (0.1 or lower) means that no (zero) New COVID-19 Deaths have been reported by the country in the past 7 days, up to and including the date mentioned on the chart.
Move the mouse cursor over the chart to see the underlying numbers.
Move the mouse cursor over the chart to see the underlying numbers.
Move the mouse cursor over the chart to see the underlying numbers.