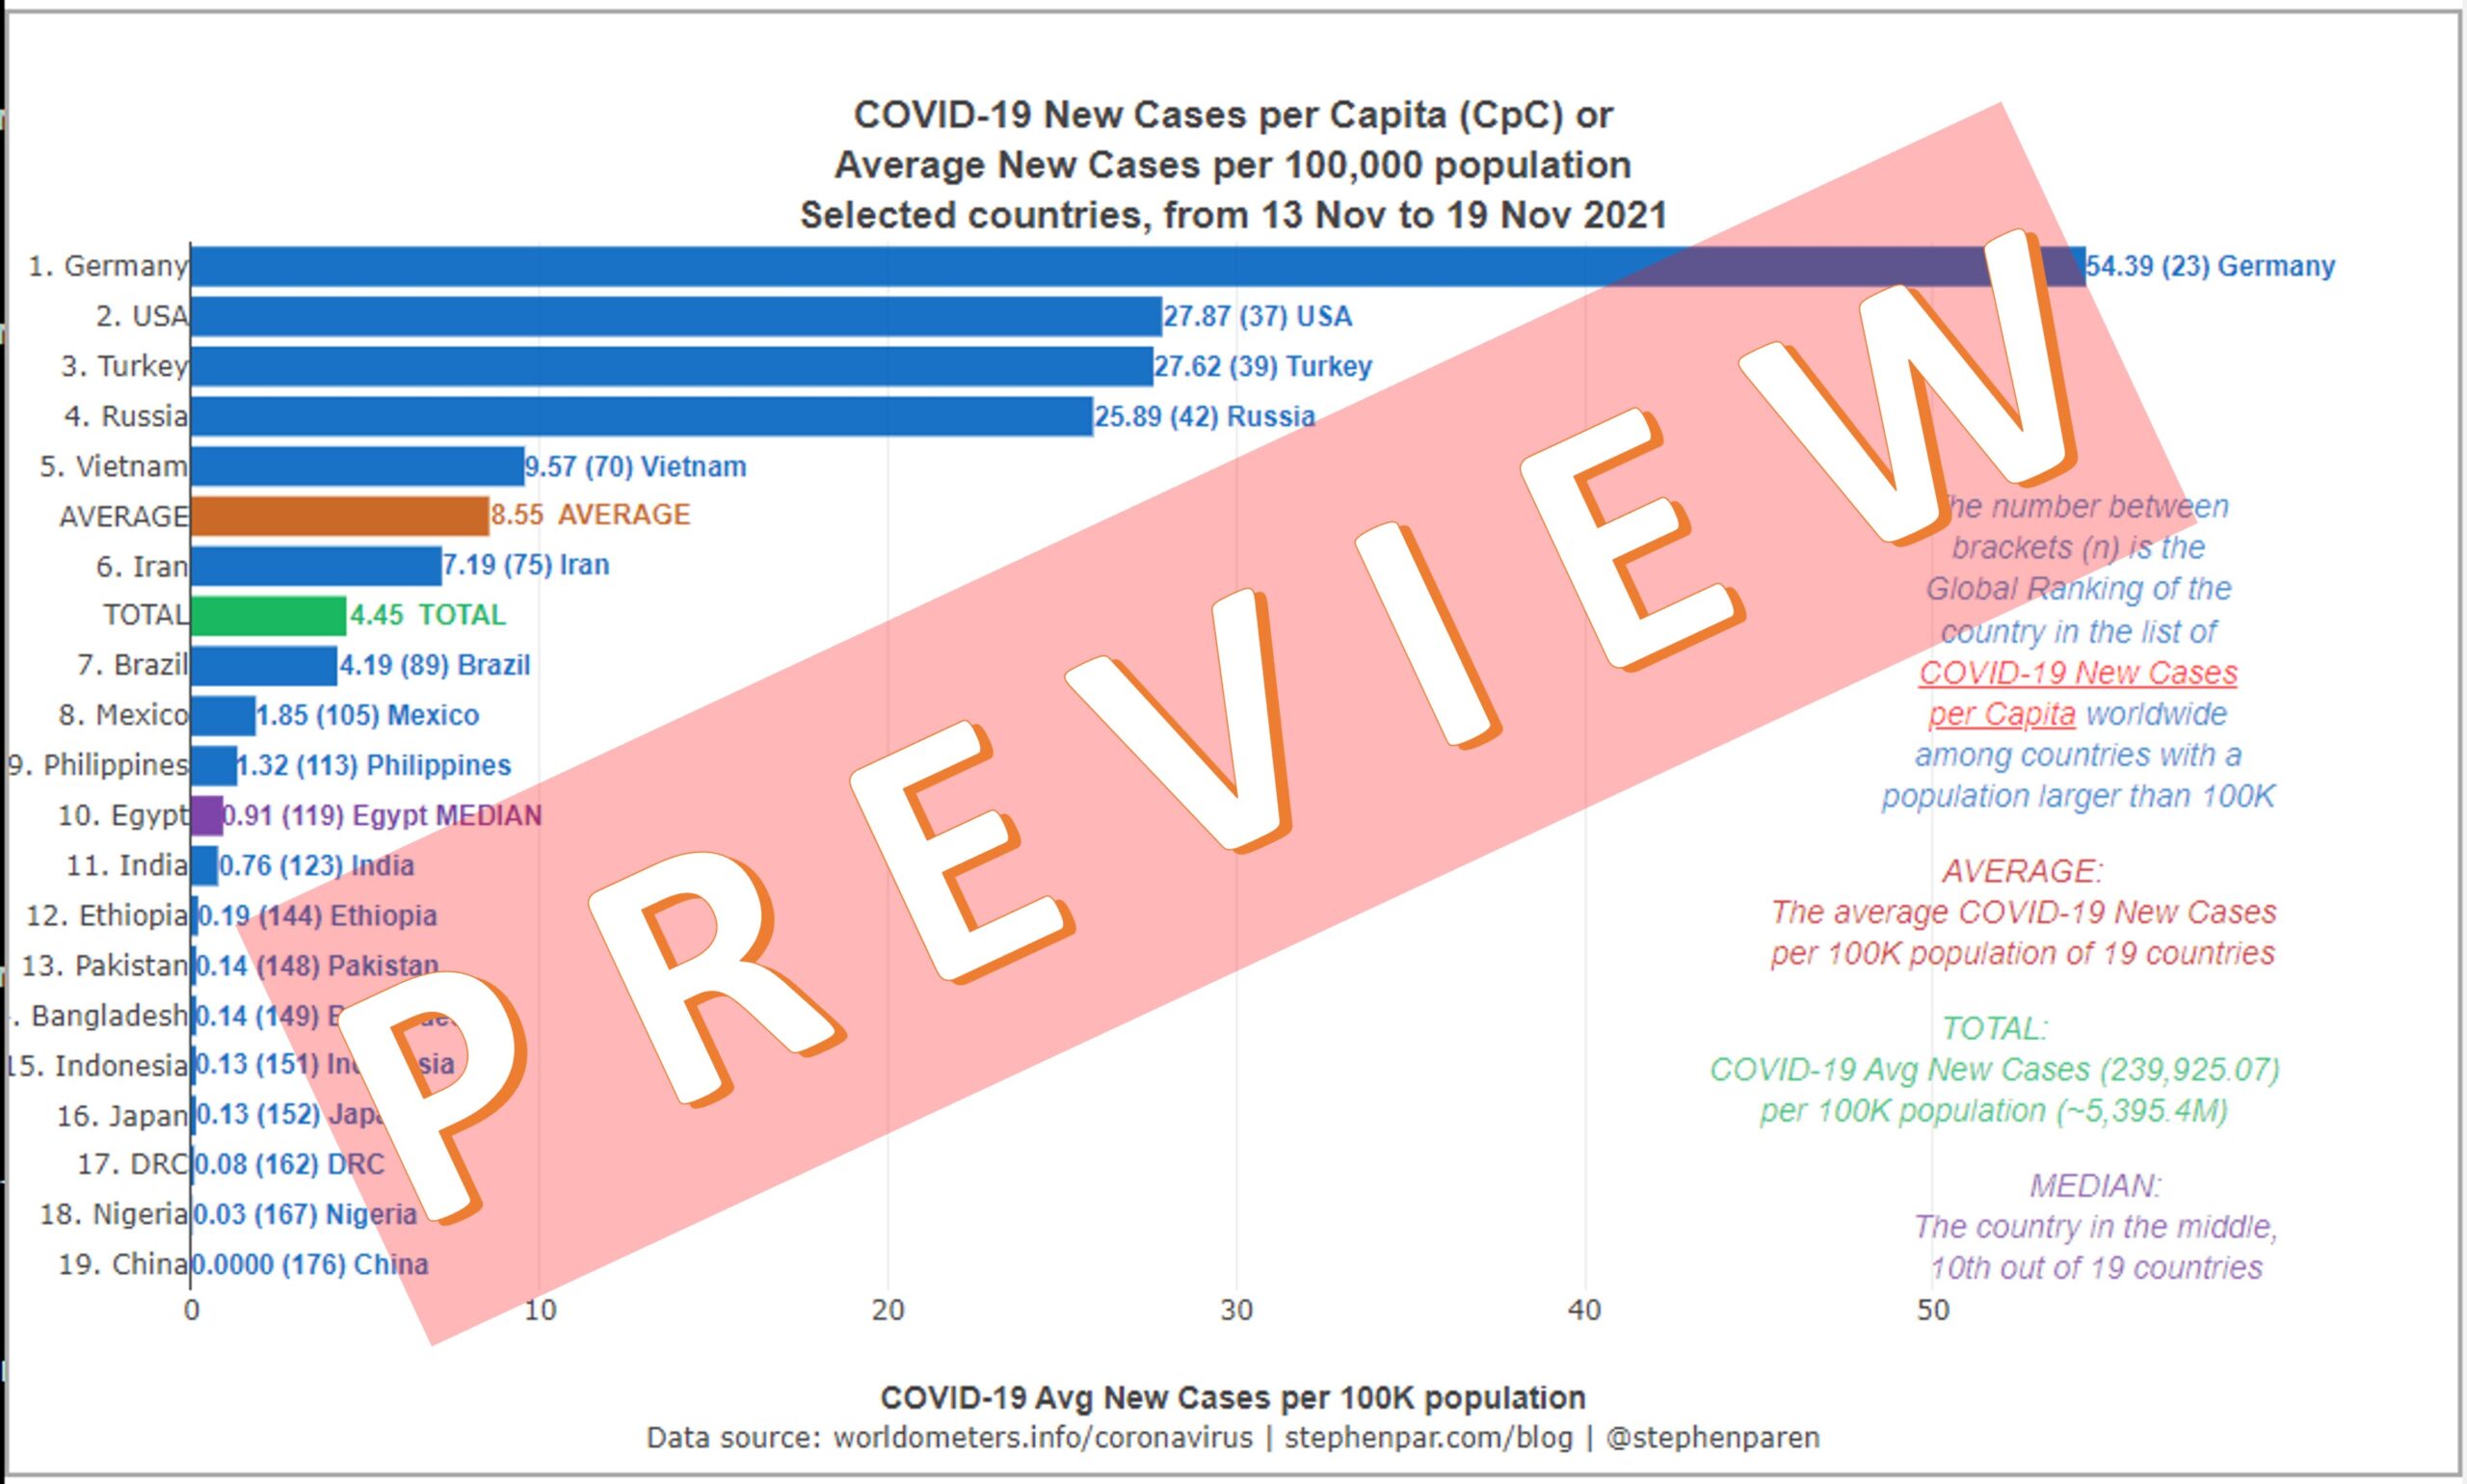
The following chart shows:
- the average number of new daily Covid-19 Cases per Capita (per 100,000 of population)
- in the 7-day period from 13 to 19 November 2021
- in countries worldwide
- with a population size above 80 million.
The following chart shows:
- the total number of Covid-19 Cases
- from the start of the pandemic in 2020
- on 19 November 2021
- in countries worldwide
- with a population size above 80 million.
The following chart shows:
- the total number of Covid-19 Cases per Capita (per 100,000 of population)
- from the start of the pandemic in 2020
- on 19 November 2021
- in countries worldwide
- with a population size above 80 million.
The following chart shows:
- the average number of new daily Covid-19 Deaths per Capita (per 100,000 of population)
- in the 7-day period from 13 to 19 November 2021
- in countries worldwide
- with a population size above 80 million.
The following chart shows:
- the total number of Covid-19 Deaths
- from the start of the pandemic in 2020
- on 19 November 2021
- in countries worldwide
- with a population size above 80 million.
The following chart shows:
- the total number of Covid-19 Deaths per Capita (per 100,000 of population)
- also called the Mortality Rate per Capita (MRpC)
- from the start of the pandemic in 2020
- on 19 November 2021
- in countries worldwide
- with a population size above 80 million.
The following chart shows:
- the total number of Covid-19 Deaths as a percentage of Covid-19 Cases
- also called the Case Fatality Rate (CFR)
- from the start of the pandemic in 2020
- on 19 November 2021
- in countries worldwide
- with a population size above 80 million.
